Zero to Enterprise in 1 year
Trustpoint AI (Formerly Encircle Labs)

Contributor
Marc Levinson
Highlights
7 figure series A
Led build of company's MVP, facilitating fundraising
Built POC and MVP
Sequenced roadmap to deliver signal-rich POC, then layer in integrations for the MVP
Led product integrations
Integrated KYC/KYB, ACH payments, audit trails, and risk scoring
Built product and engineering team
Structured cross-functional team: hired and onboarded designers, PMs, engineers and contractors
Expanded advisory board
Tapped network to help fill out advisory board with Dev-Ops, Security and Compliance
Understanding the problem and building a proof of concept
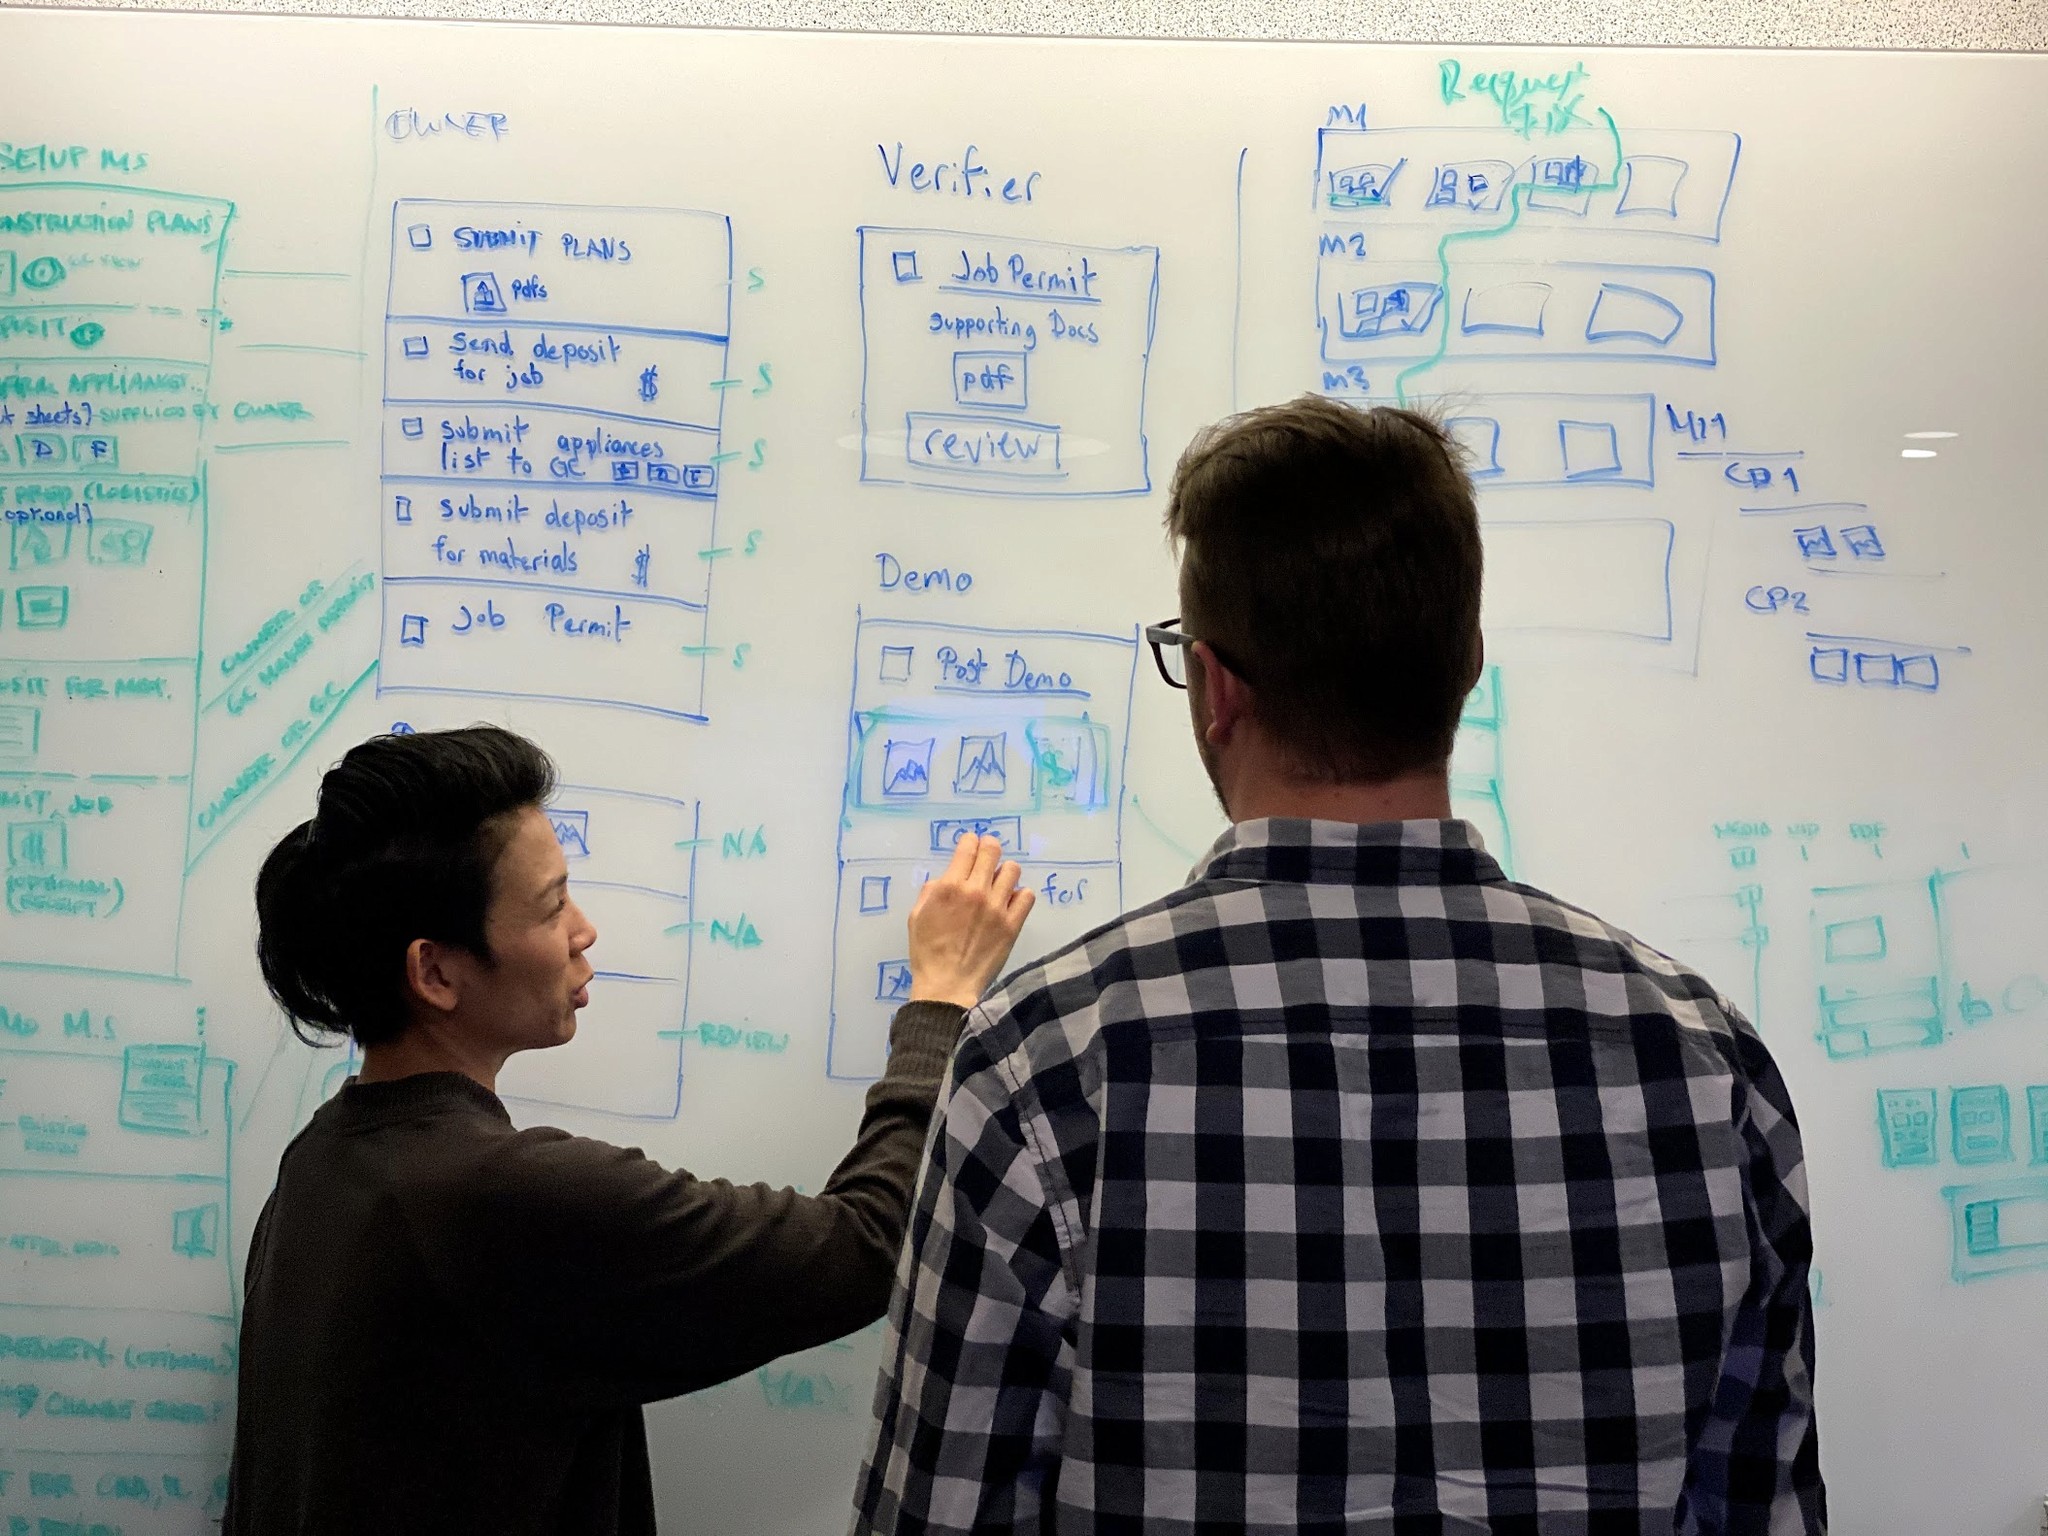
I partnered with the CEO and some advisors, including a general contractor, to map out the real-world process of completing work and getting paid. We began by identifying friction points like long delays, manual inspections, and disjointed communication. We also broke down how to intake, handle and surface information for projects which vary significantly in structure and requirements.

We had a heavy focus on the relationship between contractors and inspectors. I sketched flows on the whiteboard as we discussed how a mobile app would solve for getting payments approved more quickly. I created a high-level UI concept to demonstrate our concept, then built a clickable Figma prototype to do some early testing. To support the more complex handoffs between users, we brought in a developer to build a bare-bones coded version that we could test more thoroughly.
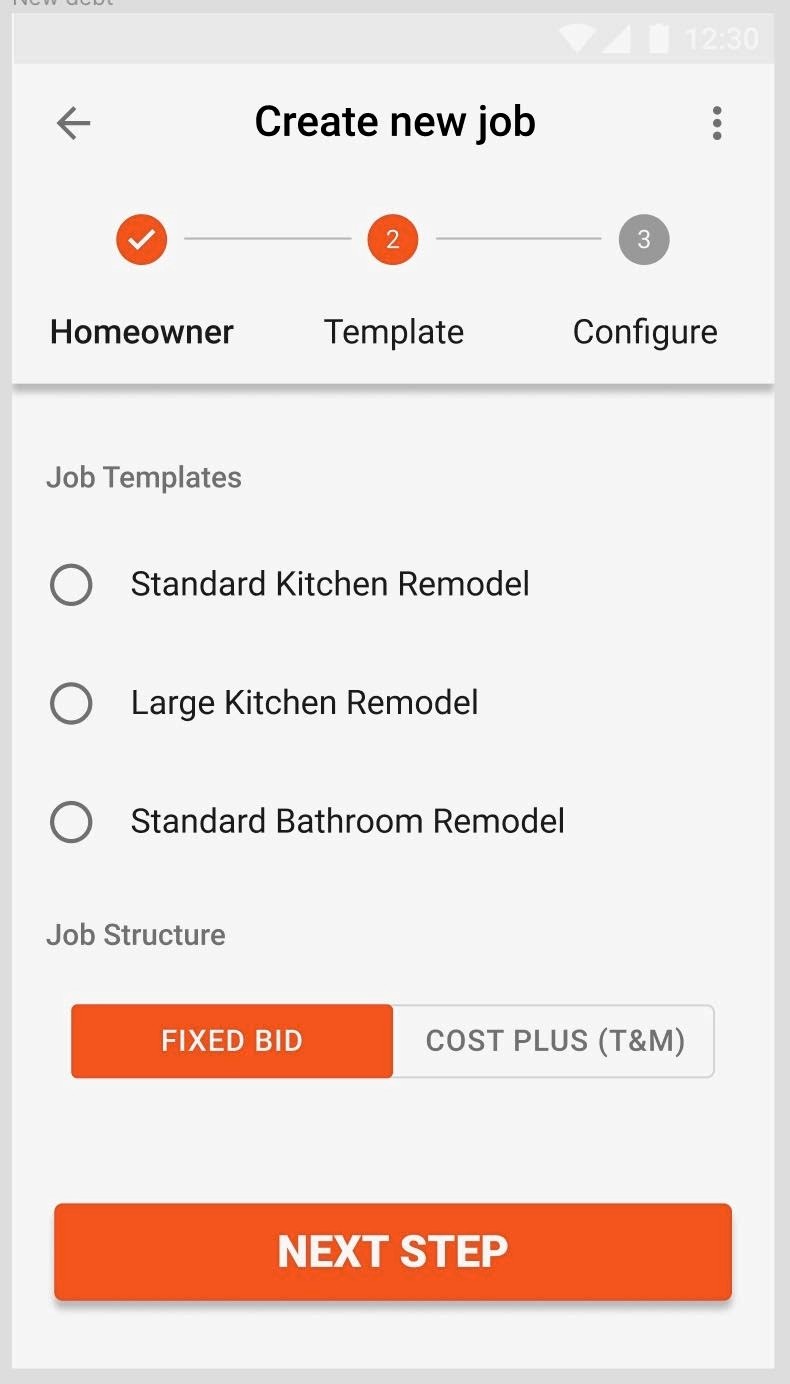
Figma Prototype
I created a high-level UI concept to demonstrate our concept, then built a clickable Figma prototype to do some early testing.
We intentionally prioritized functionality over polish. The result was our first testable proof of concept.
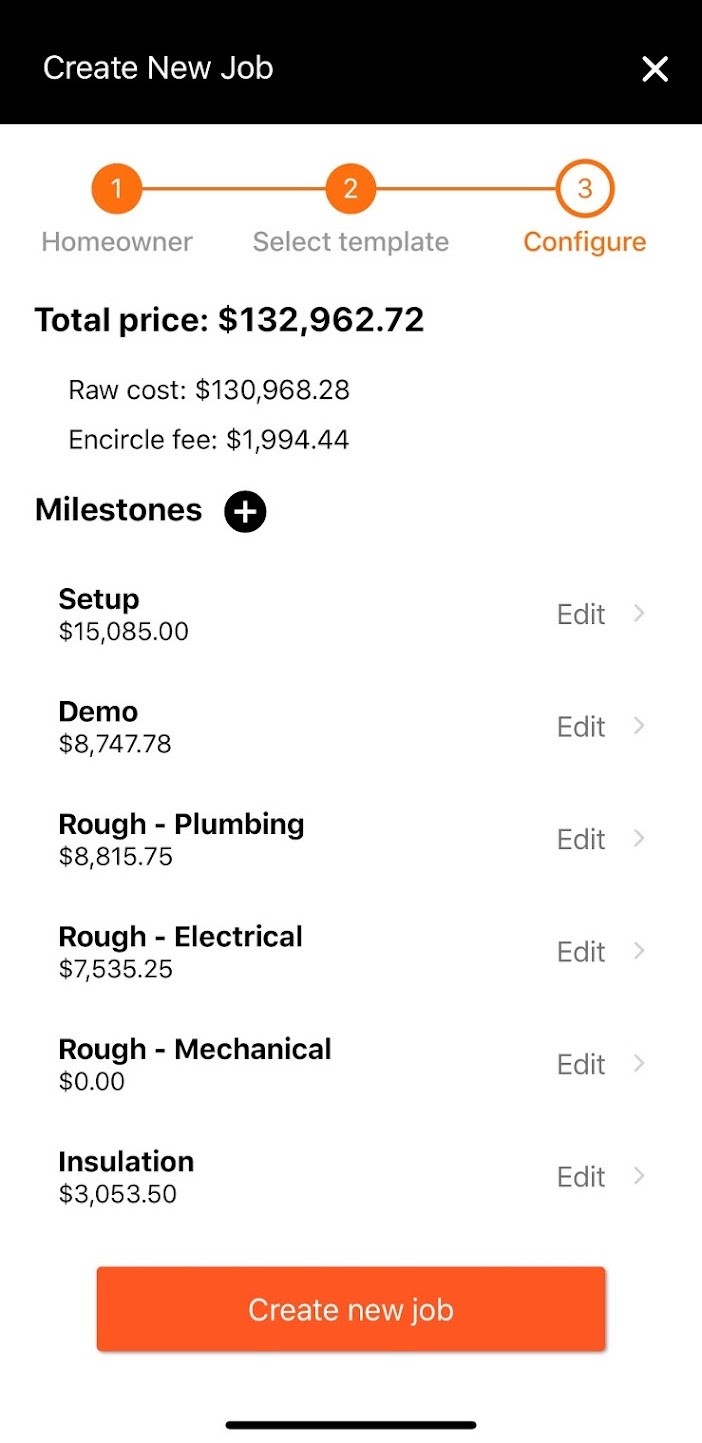
Coded protoype
To support the more complex handoffs between users, we brought in a developer to build a bare-bones coded version that we could test more thoroughly.
Adapting to our findings
As we validated the concept with a small group of beta testers, it became clear that the most valuable user in our system was the construction lender. Lenders manage large portfolios, each project at a different phase and each carrying significant risk. About 70% of construction projects fail to deliver on expectations, and over 90% run over budget.
There’s often a misconception around the term “minimum viable product.” Technically, we could have launched our contractor-focused app beyond the beta group. But in practice, contractors weren’t as proactive about tracking projects as we expected. When we shifted focus to better serve lenders, the incentive structure aligned more cleanly. As an added benefit, the total addressable market expanded substantially as each client onboarded would bring several projects as once. A contractor oriented tool wasn’t a viable business. For us, a fully resolved lender dashboard was the true MVP. That clarity in positioning also sparked stronger interest from investors.
As we leaned into building for lenders, I hired and onboarded our first designer (pictured presenting to our COO) and began expanding the product into a web dashboard. Together, we refined the UX and had more bandwidth to support the growing list of user types. I also brought on three developers to help handle the added complexity. I set up sprints for the entire R&D team to follow, formalized our process for writing requirements, set up daily stand-ups and weekly engineering demos. As some of our advisors came on full time, they filled out our executive leadership team. I started reporting out weekly on my teams milestones and showed data on how much work we were burning down. We also began sessions where we would review our highest priorities and adjust accordingly.
Launching an enterprise platform
As we approached the end of year one, I had led implementation of structured workflows for collecting signatures and managing status of critical documents like lien waivers, change orders, and draw approvals. We also integrated KYC and KYB onboarding to help our customers get set up quickly and compliantly.
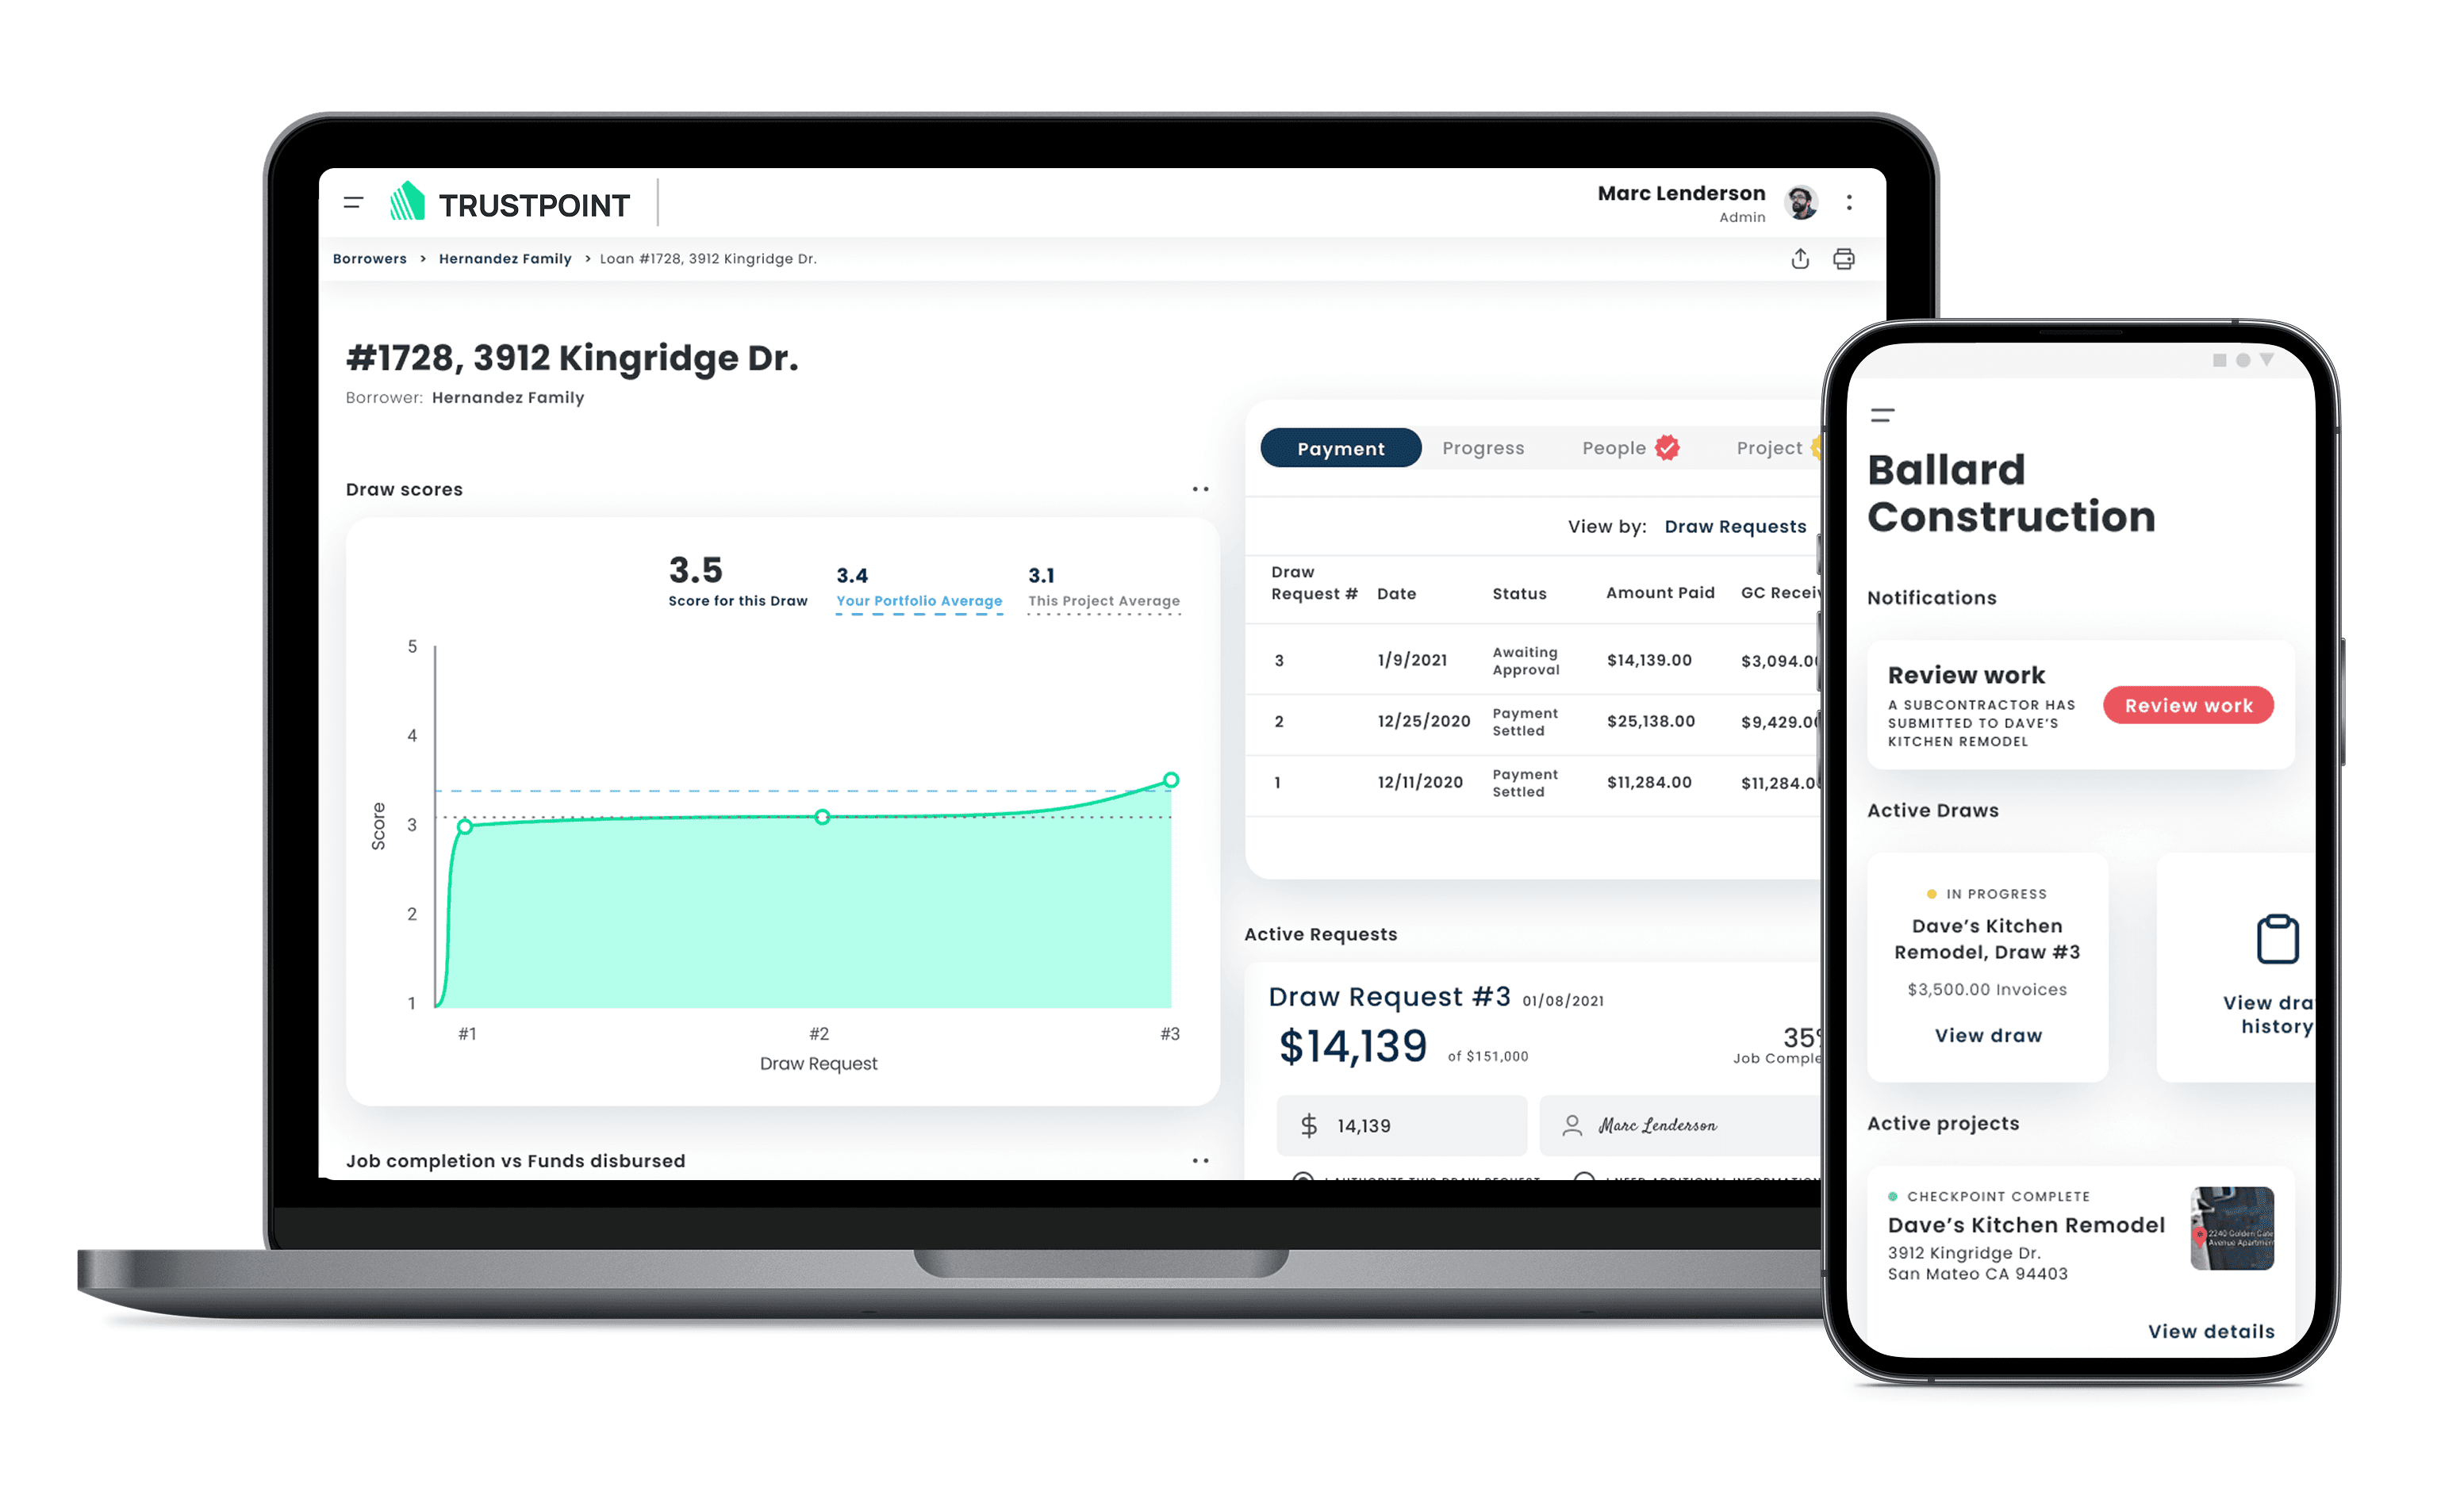
Front and center was a concept developed by our CEO. A project risk score based on numerous data points. All of the underlying details remained accessible, but the goal was to build enough trust in our scoring models that lenders could approve draw requests at a glance. The lender-facing risk score became a critical part of our product value and one of the clearest differentiators in the market.
I partnered with our seasoned, PhD Data Scientist and machine learning specialist who was working to identify the strongest predictors of project risk. We captured structured data, including milestone progress, visual proof, and budget status, as well as metadata like contractor license status, photo geolocation, and even job site weather and humidity conditions. I led charge on how this data was organized and surfaced to lenders inside the dashboard.
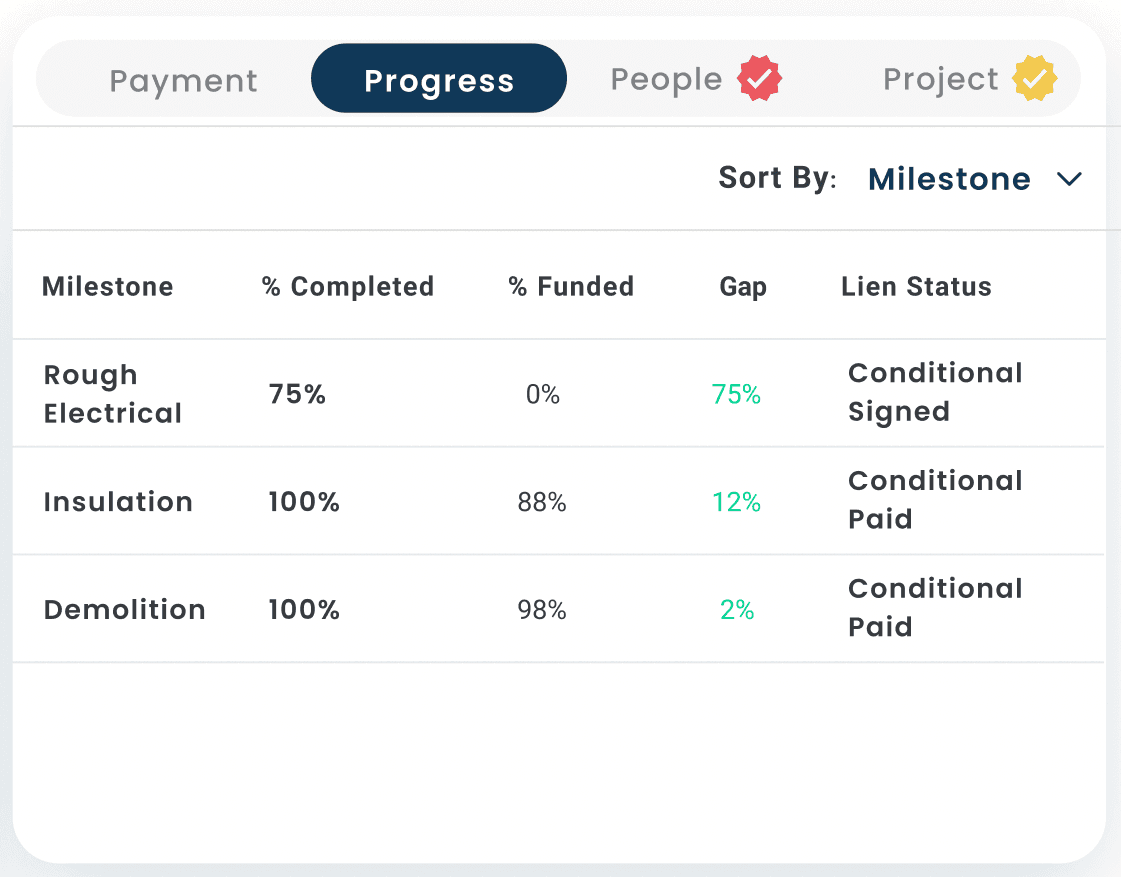

Payment | Progress | People | Project
Upon review of a draw request any concerning factors were highlighted so they could be easily addressed.

Contractor side project tracking
With the lenders onboard, contractors were much more eager to submit their work.
With faster draw approvals, they received payments within 24 hours, down from an average of 2 weeks.
